Build npv graph. Investment project in Excel with examples for calculations. Internal rate of return netindoh()
To calculate the internal rate of return (internal rate of return, IRR) in Excel, use the IRR function. We will consider its features, syntax, and examples in the article.
Features and syntax of the VSD function
One of the methods for evaluating investment projects is the internal rate of return. Calculation can be done automatically using the VSD function in Excel. It finds the internal rate of return for a series of cash flows. Financial indicators must be presented in numerical values.
Amounts within streams may fluctuate. But the receipts are regular (every month, quarter or year). This is a prerequisite for correct calculation.
Internal rate of return (IRR, internal rate of return) is the interest rate of an investment project at which the present value of cash flows equals zero. At this rate, the investor will return the initially invested funds. Investments consist of payments (amounts with a “-” sign) and income (with a “+” sign), which occur in equal time periods.
Arguments of the VSD function in Excel:
- Meanings. The range of cells that contain numeric expressions of funds. For these amounts, you need to calculate the internal rate of return.
- Assumption. A figure that is supposedly close to the result. The argument is optional.
Secrets of the IRR function:
- A range containing monetary amounts must contain at least one positive and one negative value.
- For the VSD function, the order of payments or receipts is important. That is, cash flows must be entered into the table in accordance with the time of their occurrence.
- Text or Boolean values, empty cells are ignored in the calculation.
- Excel uses the iteration (fit) method to calculate the internal rate of return. The formula performs cyclic calculations from the value specified in the Assumption argument. If argument is omitted, from value 0.1 (10%).
When calculating IRR in Excel, the #NUM! error may occur. Why? Using the iteration method in the calculation, the function finds the result with an accuracy of 0.00001%. If after 20 attempts it fails to obtain a result, the VSD will return an error value.
When the function shows a #NUM! error, repeat the calculation with a different value for the Guess argument.
Examples of the VSD function in Excel
Let's consider the calculation of the internal rate of return using an elementary example. The following inputs are available:
The amount of the initial investment is 7000. During the analyzed period there were two more investments – 5040 and 10.
Go to the “Formulas” tab. In the “Financial” category we find the VSD function. Fill in the arguments.

Values – a range with the amounts of cash flows for which it is necessary to calculate the internal rate of return. Let's leave out the assumption.

The required IRR (internal rate of return) of the analyzed project is the value of 0.209040417. If we convert the decimal expression of the value into percentages, we get a rate of 20.90%.
In our example, the IRR calculation was made for annual flows. If you need to find the IRR for monthly flows for several years at once, it is better to enter the “Assumption” argument. The program may not cope with the calculation in 20 attempts - the #NUMBER! error will appear.
Another indicator of the effectiveness of an investment project is NPV (net present value). NPV and IRR are related: IRR determines the discount rate at which NPV = 0 (that is, project costs equal revenues).
To calculate NPV in Excel, the NPV function is used. To find the internal rate of return using the graphical method, you need to plot the change in NPV. To do this, we will substitute different values of discount rates into the NPV calculation formula.

Based on the data obtained, we will construct a graph of changes in NPV.

The intersection of the graph with the X-axis (when the project's net present value is zero) gives the IRR for that project. The graphical method showed a VSD result similar to that found in Excel.
How to use the VSD indicator:
If the IRR value of the project is higher than the cost of capital for the enterprise, then this investment project must be accepted.
That is, if the loan rate is less than the internal rate of return, then borrowed funds will bring profit. Since during the implementation of the project we will receive a higher percentage of income than the amount of capital.
Let's return to our example. Let’s say that to launch a project, a bank loan was taken out at 15% per annum. The calculation showed that the internal rate of return was 20.9%. You can make money on such a project.
Let's expand on the concept of net present value (NPV) of an investment project, give a definition and economic meaning, use a real example to look at calculating NPV in Excel, and also consider a modification of this indicator (MNPV).
Net present value(NPVNetPresentValue, net present value, net present value)– shows the effectiveness of an investment in an investment project: the amount of cash flow during the period of its implementation and reduced to the current value (discounting).
Net present value. Calculation formula
where: NPV – net present value of the investment project;
CFt (Cash Flow) – cash flow in time period t;
IC (Invest Capital) – investment capital represents the investor’s expenses in the initial time period;
r – discount rate (barrier rate).
Making investment decisions based on the NPV criterion
The NPV indicator is one of the most common criteria for evaluating investment projects. Let us consider in the table what decisions can be made at different NPV values.
Calculate and forecast future cash flow (CF) in Excel
Cash flow represents the amount of cash that a company/enterprise has at a given point in time. Cash flow reflects the financial strength of a company. To calculate cash flow it is necessary from the cash inflow (CI,Cash Inflows) means to take away the outflow (CO,Cash Outflows) , the calculation formula will look like this:
![]()
Determining the future cash flow of an investment project is very important, so let’s consider one of the forecasting methods using MS Excel. Statistical forecasting of cash flows is only possible if the investment project already exists and is operating. That is, funds are needed to increase its capacity or scale it. I would like to note that if the project is a venture project and does not have statistical data on production volumes, sales, costs, then an expert approach is used to assess future cash income. Experts compare this project with analogues in this area (industry) and assess the potential for possible development and possible cash flows.
When forecasting the volume of future receipts, it is necessary to determine the nature of the relationship between the influence of various factors (forming cash receipts) and the cash flow itself. Let's look at a simple example of predicting future cash flows from a project depending on advertising costs. If there is a direct relationship between these indicators, then you can predict what cash receipts will be depending on costs using linear regression in Excel and the “TREND” function. To do this, we write the following formula for advertising costs of 50 rubles.
Cash Flow (CF). B12=TREND(B4:B11,C4:C11,C12)

The size of the future cash flow will be 4831 rubles. with advertising costs of 50 rubles. In reality, determining the size of future revenues is influenced by a much larger number of factors, which should be selected according to the degree of influence and their relationship with each other using correlation analysis.
Determining the discount rate (r) for an investment project
Calculating the discount rate is an important task in calculating the current value of an investment project. The discount rate represents the alternative return that an investor could have received. One of the most common purposes for determining a discount rate is to estimate the value of a company.
To estimate the discount rate, methods such as the CAPM model, WACC, Gordon model, Olson model, E/P market multiples model, return on equity, Fama and French model, Ross model (ART), expert assessment, etc. are used. There are many methods and their modifications for estimating the discount rate. Let us consider in the table the advantages and initial data that are used for the calculation.
| Methods | Advantages | Initial data for calculation |
| CAPM model | Taking into account the impact of market risk on the discount rate | |
| WACC model | The ability to take into account the efficiency of using both equity and borrowed capital | Quotations of ordinary shares (MICEX exchange), interest rates on borrowed capital |
| Gordon model | Accounting for dividend yield | Quotations of ordinary shares, dividend payments (MICEX exchange) |
| Ross model | Taking into account industry, macro and micro factors that determine the discount rate | Statistics on macro indicators (Rosstat) |
| Fama and French model | Taking into account the impact on the discount rate of market risks, the size of the company and its industry specifics | Quotations of ordinary shares (MICEX exchange) |
| Based on market multiples | Accounting for all market risks | Quotations of ordinary shares (MICEX exchange) |
| Based on return on equity | Accounting for the efficiency of using equity capital | Balance sheet |
| Based on expert assessment | The ability to evaluate venture projects and various factors that are difficult to formalize | Expert assessments, rating and point scales |
A change in the discount rate has a non-linear effect on the change in net present value; this relationship is shown in the figure below. Therefore, when choosing an investment project, it is necessary not only to compare NPV values, but also the nature of the change in NPV at different rates. Analysis of various scenarios allows you to choose a less risky project.

Calculate Net Present Value (NPV) Using Excel
Let's calculate net present value using Excel. The figure below shows a table of changes in future cash flows and their discounting. So, we need to determine the discount rate for a venture investment project. Since it has no issues of ordinary shares, no dividend payments, and no estimates of return on equity and debt capital, we will use the method of expert assessments. The evaluation formula will be as follows:
Discount rate=Risk-free rate + Risk adjustment;
Let's take a risk-free rate equal to interest on risk-free securities (GKOs, OFZs, these interest rates can be viewed on the website of the Central Bank of the Russian Federation, cbr.ru) equal to 5%. And adjustments for industry risk, the risk of the impact of seasonality on sales and personnel risk. The table below shows estimates of adjustments taking into account these identified types of risk. These risks have been identified by experts, so when choosing an expert you need to pay close attention.
| Types of risk | Risk adjustment |
| Risk of seasonality affecting sales | 5% |
| Industry risk | 7% |
| Personnel risk | 3% |
| 15% | |
| Risk-free interest rate | 5% |
| Total: | 20% |
As a result, adding up all the adjustments for the risk affecting the investment project, the discount rate will be = 5 + 15 = 20%. After calculating the discount rate, it is necessary to calculate the cash flows and discount them.
Two options for calculating net present value NPV
The first option for calculating net present value consists of the following steps:
- Column “B” reflects the initial investment costs = 100,000 rubles;
- Column “C” reflects all future planned cash receipts for the project;
- Column "D" records all future cash expenses;
- Cash flow CF (column “E”). E7= C7-D7;
- Calculation of discounted cash flow. F7=E7/(1+$C$3)^A7
- Calculate the present value (NPV) minus the initial investment cost (IC). F16 =SUM(F7:F15)-B6
The second option for calculating net present value is to use Excel's built-in NPV (net present value) financial function. Calculation of the net present value of a project minus initial investment costs. F17=NPV($C$3;E7;E8;E9;E10;E11;E12;E13;E14;E15)-B6
The figure below shows the resulting net present value calculations. As we can see, the final result of the calculation is the same.

Modification of net present value MNPV (Modified Net Present Value)
In addition to the classic net present value formula, financiers/investors sometimes use its modification in practice:

MNPV – modification of net present value;
CF t – cash flow in time period t;
I t – cash outflow in time period t;
r – discount rate (barrier rate);
d – level of reinvestment, interest rate showing possible income from reinvestment of capital;
n – number of analysis periods.
As we see, the main difference from the simple formula is the possibility of taking into account the profitability from reinvestment of capital. Evaluation of an investment project using this criterion has the following form:
Advantages and disadvantages of the net present value valuation method
Let's compare the advantages of the NPV and MNPV indicators. The advantages of using these indicators include:
- Clear boundaries for choosing and assessing the investment attractiveness of the project;
- Possibility of taking into account additional project risks in the formula (discount rate);
- Using a discount rate to reflect changes in the value of money over time.
The disadvantages of net present value include the following:
- Difficulty in assessing complex investment projects that involve many risks;
- Difficulty in accurately forecasting future cash flows;
- No influence of intangible factors on future profitability (intangible assets).
Summary
Despite a number of shortcomings, the net present value indicator is key in assessing the investment attractiveness of a project, comparing it with analogues and competitors. In addition to estimating NPV, for a clearer picture, it is necessary to calculate investment ratios such as IRR and DPI.
Galtsev Dmitry Alexandrovich
The term “net present value” usually denotes the value of the total discounted values of payment flows, the value of which is given in real time (as of today).
Short abbreviation, NPV. In the specialized literature, other names for this quantity are often used.
For example:
- NPV (net present value). This name is explained by the fact that the flows in question are first discounted and only then added up;
- NPV (net present value). Discounting brings all financial flows to the real (today's) value of money.
International designation – NPV.
Economic meaning of NPV indicator
If we consider the indicator more deeply, we can state that this is the resulting value obtained by taking into account all outgoing and incoming cash receipts of the analyzed investment project, reduced to the time of such analysis.
The resulting value gives the investor an idea of what he can expect when investing (taking into account the repayment of initial costs incurred at the initial stage of project development and periodic outflows during its implementation).
Due to the fact that all cash flows are calculated taking into account risks and time value, the NPV value of an investment project can be characterized as the value added by the project, or as the total profit of the investor.
The main goal of any business is to make a profit.
In order not to invest in risky projects, the investor conducts a preliminary assessment of possible investment options. Moreover, all such proposals at the stage of their preliminary study are evaluated in comparison with the profitability of risk-free investments (bank deposit).
To understand the algorithm for calculating net present value, it should be taken into account that it is based on the methodology of discounting all available cash flows. That is why the decision to invest in a particular project is made after a preliminary calculation of the NPV of the project, within the framework of which:
- all expected inflows and outflows of capital for the accounting period are assessed;
- its value is determined (for the investor this value is considered as a discount rate);
- taking into account the mentioned rate, all incoming and outgoing flows are discounted;
- the results are summarized. The result obtained is the value of the present value of the project.
The resulting number can have the following values.
NPV = 0. This informs the investor that he has a probability of returning the invested funds with a minimal profit.
NPV< 0. Подобные инвестиционные проекты дальнейшему рассмотрению не подлежат.
NPV > 0. The investment should bring profit.
Basic calculation formula:
Symbols used:
- N is the number of periods (months, quarters, years) for which the project being evaluated is calculated;
- t is the time period for which the net present value is considered;
- i is the calculated discount rate for the investment option being evaluated;
- CF t – expected cash flow (net) for a specified time period.
An example of how NPV is calculated (for convenience, we summarize the results in tables and diagrams).
A comparative analysis of two projects with equal starting investments is performed. Let it be 5 million rubles. Both options are characterized by approximately equal risks of uncertainty of available cash flows. For simplicity of calculation, we assume that the cost of raising funds is also the same and equal to 11.5%.
By filling out the form you agree to our privacy policy and consent to the newsletter
The main difference lies in the dynamics of inflows and outflows of funds.

Using the calculation formula given above, we obtain the following discounted flows

The obtained results of the NPV of the project should be interpreted as follows:
- if the investor is offered two independent projects, both should be accepted;
- if they are mutually exclusive, then project “A” has an undeniable advantage, since it has the best NPV.
The value of the discount rate when calculating NPV
When studying net present value, you should definitely pay serious attention to the indicator - the discount rate. It is often referred to differently as the opportunity cost of investment. The indicator used in the calculation formula denotes the minimum return that the investor considers acceptable for risks comparable to those of the project being implemented.
An investor can operate with funds raised from various sources (own or borrowed).
1. In the first case, the discount rate set is a personal assessment of the acceptable risks of the investment project under consideration.
Its assessment can take several approaches. The simplest ones are:
- Selecting a risk-free rate, adjusted taking into account the likelihood of specific risks.
As such, the yield on securities of the state in which the project is being implemented and the rate of return on corporate bonds of companies in the industry are usually considered.
- Necessary and minimum sufficient (from the point of view of a potential investor) profitability (ROE indicator).
In this case, the person making the investment decision determines the discount rate according to one of the possible options:
- funds available on deposit in a specific bank are invested in the project. Therefore, the opportunity cost should not be less than the available bank rate;
- Funds withdrawn from business and temporarily available are invested in the project. If a need arises for them, prompt withdrawal of the entire amount from the project is impossible. A loan will be required. Therefore, the market lending rate is chosen as the current cost of funds;
- The average profitability of the main business is Y%. Accordingly, you are required to receive no less from an investment project.
2. When working with borrowed funds, the rate will be calculated as a derivative of the cost of funds attracted from various sources.
As a rule, the rate set by the investor in such cases exceeds a similar indicator of the cost of borrowed funds.
This not only takes into account changes in the value of funds over time, but also introduces possible risks associated with the uncertainty of cash flows and their volumes.
This is the main reason why the discount rate is considered to be the weighted average cost of capital attracted for subsequent investment (WACC).
It is this indicator that is considered as the required rate of return on funds invested in a specific investment project. The higher the expected risks, the higher the rate.
Calculation methods for determining this parameter are less clear than graphical ones. Especially when you need to compare the attractiveness of two or more projects.
For example, comparing projects “A” and “B” (see graph) the following conclusions can be drawn:

When the rate exceeds 7%, the NPV value of project A is higher than that of B (which warns of a possible error in the choice during arithmetic comparison).
In addition, investment project “B”, indicated on the red curve graph, is subject to more significant changes due to a changing discount rate (this can be explained by different amounts of incoming funds in the same period of time).
It is necessary to take into account the fact of a significant decrease in the value of discount rates over time, which imposes certain time restrictions. They can be calculated in no more than 10 years.
Analysis of the graphs allows us to conclude that a changing discount rate leads to changes in the value of the NPV indicator (and the latter changes nonlinearly).
Therefore, for a more balanced assessment, it is necessary not only to compare the values for different investment projects, but also to take into account changes in the latter at different rates.
By default, when calculating in Excel, the discount rate is assumed to be 10%.
Calculation of NPV using Excel
The program provides the ability to determine the value under consideration using the “NPV” function.

The operating algorithm is quite simple.
- select “H6” (output cell);
- after pressing fx (button) in the window that opens, first the category – “Financial”, and then the function – “NPV” is selected;
- going to the “Bet” field, select cell “C1”;
- then the range of data used (in this case this is C6:G6) is entered in a special field called “Value 1”. The second field should be left blank “Value 2”. After this, press “OK” (button).
Since the option under consideration does not take into account the initial (starting) investments in the project, you again need to enter “H6”, where you need to add an additional cell “B6” to the formula bar.

Pros and cons of the NPV calculation method
Among the advantages is the use of the so-called discounted cash flow technique. This provides the possibility of adequately assessing such a parameter as the amount of value additionally created as part of the implementation of the investment project.
But a number of serious shortcomings require their mandatory consideration.
These include the following:
- high sensitivity to ongoing changes in discount rates;
- ignoring cash flows, the receipt of which begins after the established deadline for the project.
Join over 3 thousand of our subscribers. Once a month we will send to your email a digest of the best materials published on our website, LinkedIn and Facebook pages.
IRR, IRR, IRR, or internal rate of return is an indicator of investment analysis that allows you to determine the profitability of an investment and the maximum possible rate on borrowed funds. It helps you compare several projects and choose the most suitable investment option. Since it is calculated through NPV, of the 4 methods it is most convenient to use the automated one - through the IRR function of the Excel spreadsheet editor.
How to determine the optimal rate at which you can attract credit resources to implement a business plan? How to determine the attractiveness of an investment project in advance? For these purposes, it is worth getting acquainted with the internal rate of return indicator.
IRR(Internal Rate of Return) is the discount rate at which the NPV (Net Present Value) value is zero.
Reference! IRR can be viewed in two ways:
- on the one hand, this is an indicator that characterizes the profitability of an investment project - the higher it is, the greater the profit from the project will be;
- on the other hand, the maximum cost of capital that can be raised for the project and, when used, will break even.
The IRR should be calculated when drawing up business plans and considering any investment options.
Important point! If you plan to use borrowed funds for investment, then the interest rate on them should not exceed the internal rate of return. Otherwise, the project will be unprofitable.
In the literature there are other names for IRR: internal rate of return (abbreviation - IRR), internal rate of return, internal rate of return, etc.
Formula for calculating IRR
Since IRR represents the discount rate in a situation where NPV is zero, the same formula is used to calculate the indicator as for determining net present value.

The given formula contains the following indicators:
- CF - total cash flow for period t;
- t - serial number of the period;
- i - cash flow discount rate (reduction rate);
- IC is the amount of the initial investment.
If NPV is known to be zero, then a complex equation is created in which the internal rate of return must be extracted from the root with the power. Therefore, IRR cannot be accurately calculated manually.
To calculate, you can use a financial calculator. However, even in this case the calculations will be cumbersome.
Previously, a graphical method was used to calculate the internal rate of return: NPV was calculated for each project and their linear graphs were built. At the points of intersection of the graphs with the abscissa axis (X axis) the IRR value was found. However, this method is inaccurate and is for demonstration purposes.

Reference! In financial mathematics, a selection method is used, which allows, using logarithmic calculations, to identify the relationship between NPV and IRR. This method is no less complicated and requires the ability to operate with logarithms.
In this regard, the simplest, most convenient and accurate way to calculate IRR is to use the IRR financial function of the Excel spreadsheet editor
Examples of IRR calculations
How to correctly calculate the IRR using the Excel spreadsheet editor? To understand the algorithm, it is worth considering two investment projects that require the same amount of initial investment - 1.5 million rubles. - but are characterized by different cash flows.
| Project No. 1 | Project No. 2 |
|
|---|---|---|
| Cash Flow (CF) |
||
At first glance it is difficult to determine:
- which one is beneficial to the investor;
- at what percentage to attract debt financing.
In order to answer these questions, you need to transfer the information to the Excel spreadsheet editor, and then perform the following steps:
- place the cursor in a free cell;
- select the financial function IRR (internal rate of return);
- in the “Values” field, indicate an array of data from the initial investment to the last cash receipt.

In the example, the IRR function must be used twice - this way you can calculate the IRR for each project.

Conclusion! The calculation showed that Project No. 1 seems more profitable, since it promises a profitability of 17%. In addition, the range of choice of borrowed funds in this case is wider: loans can be attracted at a rate of no more than 17% (for comparison, for Project No. 2 - up to 13%).
In order to learn how to use the formula for calculating IRR, it is worth downloading.
Using Excel tools to determine the value is advisable:
- the calculation error can be 0.00001% if this value is specified in the “Assumption” field of the VSD function (in the standard version the error is 0.1%);
- the function is applicable to the most convenient form of displaying cash flows - in chronological order (by year, month, etc.);
- cash flows can be positive or negative.
Important point! Among the cash flows for the project, at least one must be positive, otherwise the system will report a calculation error.
IRR value and discount rate
The internal rate of return is related to another important indicator of investment analysis - the discount rate.
Reference! The discount rate is the interest rate that an investor needs to earn on their invested capital. It reflects the value of money, taking into account the factor of time and risk, and demonstrates to the investor:
- minimum level of profitability;
- inflation rate;
- investment risk level.
Since the internal rate of return shows the cost at which borrowed funds can be attracted to a project, and the discount rate (r) shows the rate of return for the project, they are often compared as part of investment analysis.
Application of internal rate of return
The main purpose of using IRR is to rank projects according to their degree of attractiveness, regardless of the size of the initial investment and industry. There are other options for using the rate of return indicator:
- assessing the profitability of design solutions;
- determining the stability of investment directions;
- identifying the maximum possible cost of attracted resources.
Important point! Experts draw attention to such shortcomings of the indicator as the inability to take into account reinvestments and income in absolute values, and the dependence on how correctly cash flows are assessed.
In this article we will tell you in detail about discounting cash flows, the formula for calculation and analysis in Excel.
Discounting cash flows. Definition
Cash flow discounting (English Discounted cash flow, DCF, discounted value) is a reduction of the value of future (expected) cash payments to the current point in time. Discounting cash flows is based on the important economic law of diminishing value of money. In other words, over time, money loses its value compared to the current one, so it is necessary to take the current moment of assessment as the starting point and bring all future cash receipts (profits/losses) to the present time. For these purposes, a discount factor is used.
How to calculate the discount rate?
Discount coefficient used to reduce future earnings to present value by multiplying the discount factor and payment streams. The formula for calculating the discount factor is shown below:
where: r – discount rate, i – number of the time period.
 |
★ |
Discounting cash flows. Calculation formula
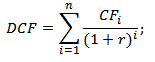
DCF ( Discounted cash flow)– discounted cash flow;
CF ( CashFlow) – cash flow in time period I;
r – discount rate (rate of return);
n is the number of time periods for which cash flows appear.
The key element in the cash flow discounting formula is the discount rate. The discount rate shows what rate of return an investor should expect when investing in a particular investment project. The discount rate uses many factors that depend on the object of evaluation, and may include: the inflation component, return on risk-free assets, additional rate of return for risk, refinancing rate, weighted average cost of capital, interest on bank deposits, etc.
Calculation of rate of return (r) for discounting cash flows
There are quite a lot of different ways and methods for estimating the discount rate (rate of return) in investment analysis. Let us consider in more detail the advantages and disadvantages of some methods for calculating the rate of return. This analysis is presented in the table below.
|
Methods for estimating discount rates |
Advantages |
Flaws |
| CAPM models | Ability to take into account market risk | One-factor, the need for the presence of ordinary shares on the stock market |
| Gordon model | Easy calculation | The need for ordinary shares and constant dividend payments |
| Weighted average cost of capital (WACC) model | Accounting for the rate of return of both equity and debt capital | Difficulty in estimating return on equity |
| Model ROA, ROE, ROCE, ROACE | Ability to take into account the return on capital of a project | Not taking into account additional macro and micro risk factors |
| E/P method | Taking into account the market risk of the project | Availability of quotes on the stock market |
| Method for estimating risk premiums | Using additional risk criteria in assessing the discount rate | Subjectivity of risk premium assessment |
| Assessment method based on expert opinions | The ability to take into account poorly formalized project risk factors | Subjectivity of expert assessment |
You can learn more about approaches to calculating the discount rate in the article “”.
|
★ (calculation of Sharpe, Sortino, Treynor, Kalmar, Modiglanca beta, VaR) + forecasting course movements |
Example of calculating discounted cash flow in Excel
In order to calculate discounted cash flows, it is necessary for the selected time period (in our case, annual intervals) to describe in detail all expected positive and negative cash payments (CI - CashInflow, CO – CashOutflow). The following payments are taken for cash flows in valuation practice:
- Net operating income;
- Net cash flow excluding operating costs, land tax and reconstruction of the facility;
- Taxable income.
In domestic practice, as a rule, a period of 3-5 years is used; in foreign practice, the assessment period is 5-10 years. The entered data is the basis for further calculations. The figure below shows an example of entering initial data into Excel.

At the next stage, cash flow is calculated for each of the time periods (column D). One of the key tasks of assessing cash flows is calculating the discount rate, in our case it is 25%. And it was obtained according to the following formula:
Discount rate= Risk-free rate + Risk premium
The key rate of the Central Bank of the Russian Federation was taken as the risk-free rate. The key rate of the Central Bank of the Russian Federation is currently 15% and the premium for risks (production, technological, innovative, etc.) was calculated by experts at the level of 10%. The key rate reflects the return on a risk-free asset, and the risk premium shows the additional rate of return on the existing risks of the project.
You can learn more about calculating the risk-free rate in the following article: “”
Afterwards, it is necessary to bring the received cash flows to the initial period, that is, multiply them by the discount factor. As a result, the sum of all discounted cash flows will give the discounted value of the investment object. The calculation formulas will be as follows:
Cash flow (CF)= B6-C6
Discounted cash flow (DCF)= D6/(1+$C$3)^A6
Total discounted cash flow (DCF)= SUM(E6:E14)

As a result of the calculation, we received the discounted value of all cash flows (DCF) equal to RUB 150,981. This cash flow has a positive value, which indicates the possibility of further analysis. When conducting an investment analysis, it is necessary to compare the final values of discounted cash flow for various alternative projects, this will allow them to be ranked according to the degree of attractiveness and efficiency in creating value.
Investment analysis methods using discounted cash flows
It should be noted that discounted cash flow (DCF) in its calculation formula is very similar to net present value (NPV). The main difference is the inclusion of initial investment costs in the NPV formula.
Discounted cash flow (DCF) is used in many methods for assessing the effectiveness of investment projects. Because these methods use discounting of cash flows, they are called dynamic.
- Dynamic methods for evaluating investment projects
- Net present value (NPVNetPresentValue)
- Internal rate of return ( IRR, Internal Rate of Return)
- Profitability index (PI, Profitability index)
- Annual annuity equivalent (NUS, Net Uniform Series)
- Net rate of return ( NRR, Net Rate of Return)
- Net future value ( NFV,NetFutureValue)
- Discounted payback period (DPPDiscountedPayback Period)
You can learn more about methods for calculating the effectiveness of investment projects in the article “”.
In addition to just discounting cash flows, there are more complex methods that in addition take into account the reinvestment of cash payments.
- Modified net rate of return ( MNPV, Modified Net Rate of Return)
- Modified rate of return ( MIRR, Modified Internal Rate of Return)
- Modified net present value ( MNPV,ModifiedPresentValue)
|
★ (calculation of Sharpe, Sortino, Treynor, Kalmar, Modiglanca beta, VaR) + forecasting course movements |
Advantages and disadvantages of the DCF indicator for discounting cash flows
+) The use of a discount rate is an undoubted advantage of this method, since it allows you to reduce future payments to the current value and take into account possible risk factors when assessing the investment attractiveness of the project.
-) The disadvantages include the difficulty of predicting future cash flows for an investment project. In addition, it is difficult to reflect changes in the external environment in the discount rate.
Summary
Discounting cash flows is the basis for calculating many coefficients for assessing the investment attractiveness of a project. We have analyzed, using an example, the algorithm for calculating discounted cash flows in Excel, their existing advantages and disadvantages. Ivan Zhdanov was with you, thank you for your attention.