Grouping by years in excel. Ungrouping grouped data. Grouping by week
Summary Excel tables have a tool for grouping fields with different types of data: dates, numbers and text. For example, you can group order dates by year or month, see the number of tested students who scored a passing grade. Manually select text items in a box pivot table and group them. This will allow you to see the subtotals for a specific set of items in the PivotTable.
Additional drilling options
Grouping data in a pivot table can help you display a subset of the data for analysis. For example, you might want to group a complex list of dates or times into quarters and months as follows. Temporary grouping of time-dependent dependencies associated with fields is automatically and grouped when temporary field rows are added to pivot tables. After grouping, you can drag the group to the pivot table and start analyzing. 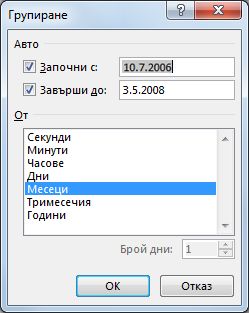
The date and hour groups are clearly marked in the pivot table.
In today's post, we'll take a look at grouping in.
Date grouping
To group by date, right-click on the date field in the pivot table. From the dropdown menu, select Group.
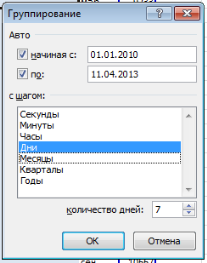
Grouping, select one or more items from the field with a step. To limit start and end dates, you can change them in the fields Beginning with and By. Click OK to close the dialog box.
Automatic grouping of columns for date and time
For example, April, May, June for several months. For getting additional information about grouping, at the end of this article. When you drag a date from a list box in an area row or column where there is already a window, and then insert a "date" above the existing field, the existing field to date is removed from the field for rows or columns, and the data will be automatically reset, so you can see this is the field when compressing data. You can also select specific items and group them as follows.

Grouping by week
To group dates by week, right-click on the date field. From the dropdown menu, select Group. In the dialog box that appears Grouping, select an item Days in field With step and indicate the number of days 7. If necessary, you can change the start date to another. We press OK.
Right-click what you have selected and click Group. ... Grouping the selected items creates a new field based on the grouped fields. For example, when you group the Salesperson field, you create a new field named Salesperson1. This field is added to the field tabs in the Field List, and you can use it like any other field.
Disaggregate aggregated data
To make the pivot table more compact, you can create groups for all other broken items in the field. For fields that are organized into levels, you can only group items that have the same item on the next level. For example, if the field has a country and city level, you cannot group cities from different countries. To remove a grouping, right-click any item in the grouped data and choose Ungroup.
Grouping numeric values
First you need to create a pivot table, and place it in line field the data you want to group.
Please note that the population figures are in field of strings.
If you ungroup a numeric or datetime field, all groups for that field are removed. If you break a group of selected items, only individual items are fragmented. The group field is not removed from the field list until all field groups are ungrouped. For example, suppose there are four cities in City: Boston, New York, Los Angeles, and Seattle. You can group them so that New York and Boston are in the group you call the Atlantic Ocean, while Los Angeles and Seattle are in the group you call the Pacific Ocean.

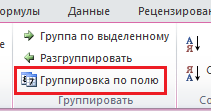
Highlight the field you want to group and navigate to the tab Working with pivot tables -> Group -> Group by field.
As shown below, four cities are located under the new groups - Atlantic Ocean and Pacific Ocean. When you undo time-grouped or auto-collapsed fields, the first undo removes all calculated fields from the field's fields, leaving only the date field. This is in line with how the undo list works in previous releases.
To group data into a pivot table
The second invalidation will remove the date field field field and discard everything. When grouping data into a PivotTable, keep in mind that. Note: no machine translation: This article is translated from a non-human computer system. Since the article has been translated by machine, it may contain errors in vocabulary, syntax and grammar. The basics of a pivot table, that is: Insert, create and delete a pivot table. Rotate fields in a pivot table. Keyboard shortcut for inserting a pivot table. Refresh the pivot table.
In the dialog box that appears Grouping, adjust the grouping range and pitch. In our case, we set the range from 0 to 12000 in 1000 increments.

In field The values put the data you want to flatten by the grouped data. In our example, I want to see the number of regions in each population range.
Grouping data by date, i.e. grouping data after a date in a pivot table. Numeric formatting: That is, correct overlap of numeric formatting in pivot tables. Grouping of numbers and text: i.e. grouping of integers. Grouping decimal numbers.
Summarize the value field: different ways summing the value field. How to sum many times in one field. Rename the fields in the pivot table. Quickly get information from the pivot table following the imposed criteria. Pivot Table: Insert a pivot chart. Link the pivot table to the pivot table.

The resulting pivot table shows the frequency distribution of the population of the regions of Russia.
![]()
Grouping text fields
Paragraph Group will be unavailable from the dropdown menu if you right click on the text field. They need to be grouped manually.
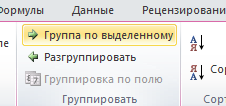
Select the field you want to group. On the ribbon, go to the tab Work with pivot tables -> Group -> Group by selection.
To rename the group name, left-click on the field and enter your name in the formula bar.
One of the most useful features of pivot tables is the ability to combine items in groups. Grouping elements is simple: select them and run the command Working with pivot tables Parameters Group Group by selection.
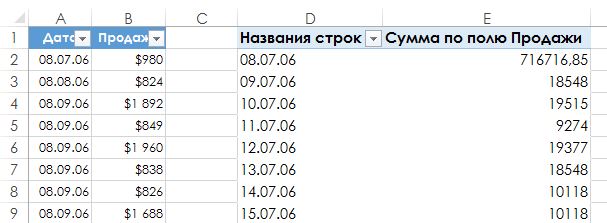
But you can take it one step further. If the field contains dates, Excel is able to create groups automatically. Many users overlook this useful feature. In fig. 171.1 shows a part of a table that has two columns of data: date and Sales... The entire table contains 93,156 rows and covers the period from July 8, 2006 to August 8, 2009. The goal is to aggregate sales information by month.
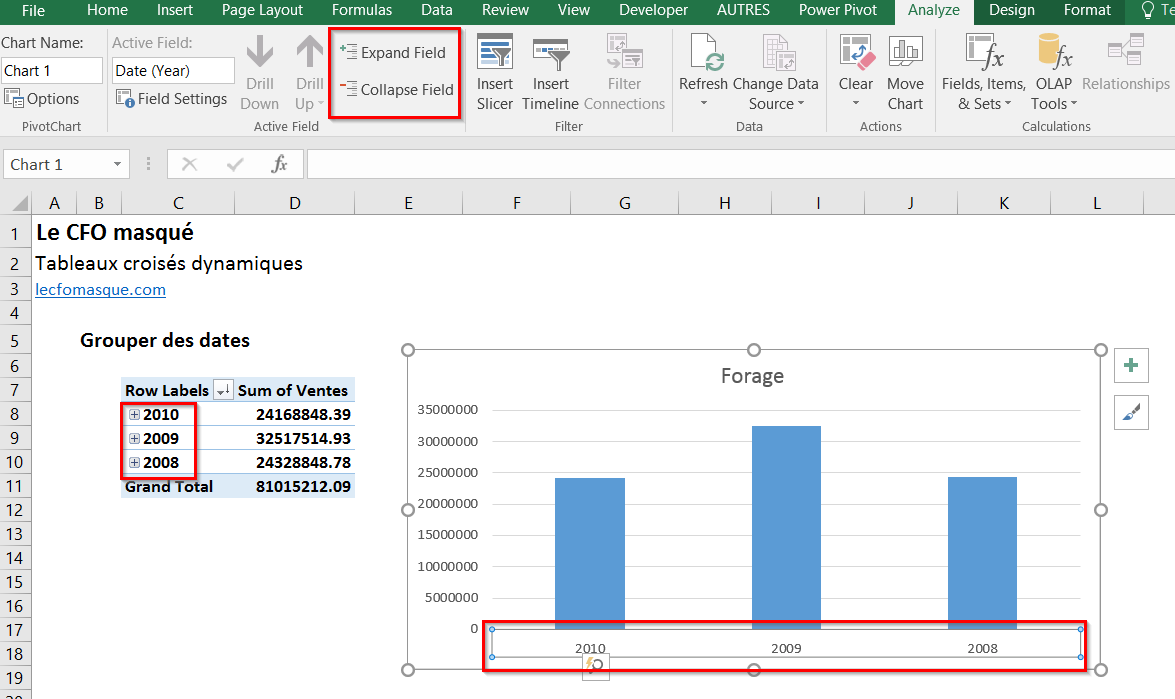
In fig. 171.2 you can see a portion of the pivot table (in columns D: E) generated from the data. Unsurprisingly, it looks the same as the input, since the dates have not been grouped. To group items by month, right click on any cell in the column date pivot table and select the item Group... You will see a window Grouping shown in Fig. 171.3. Select from the list Months and Years and make sure the start and end dates are correct. Click the button OK... The elements date in a pivot table are grouped by year and month (as shown in Figure 171.4).

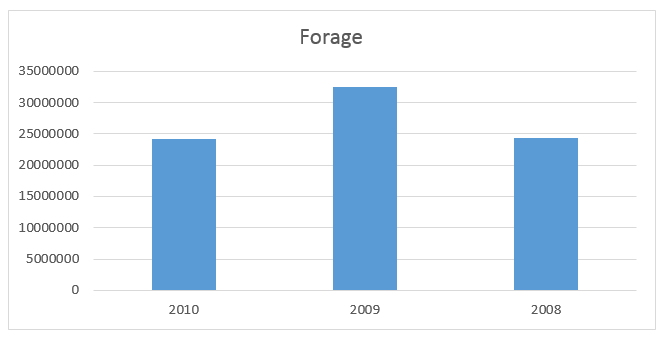
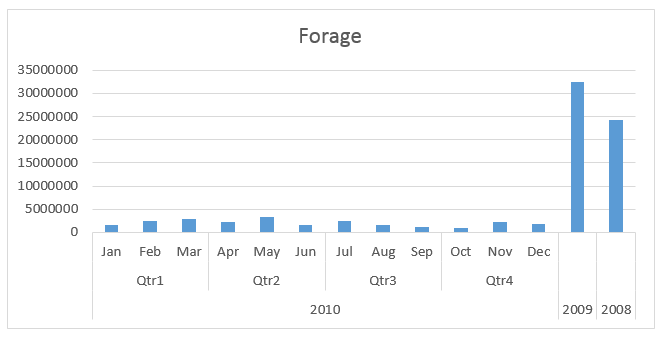
If you only choose Months in the Grouping window, the FROM months of different years will be combined. For example, June will display sales for 2008 and 2009. Note that the window Grouping contains other time-based elements as well. For example, you can group data by quarter (Figure 171.5).